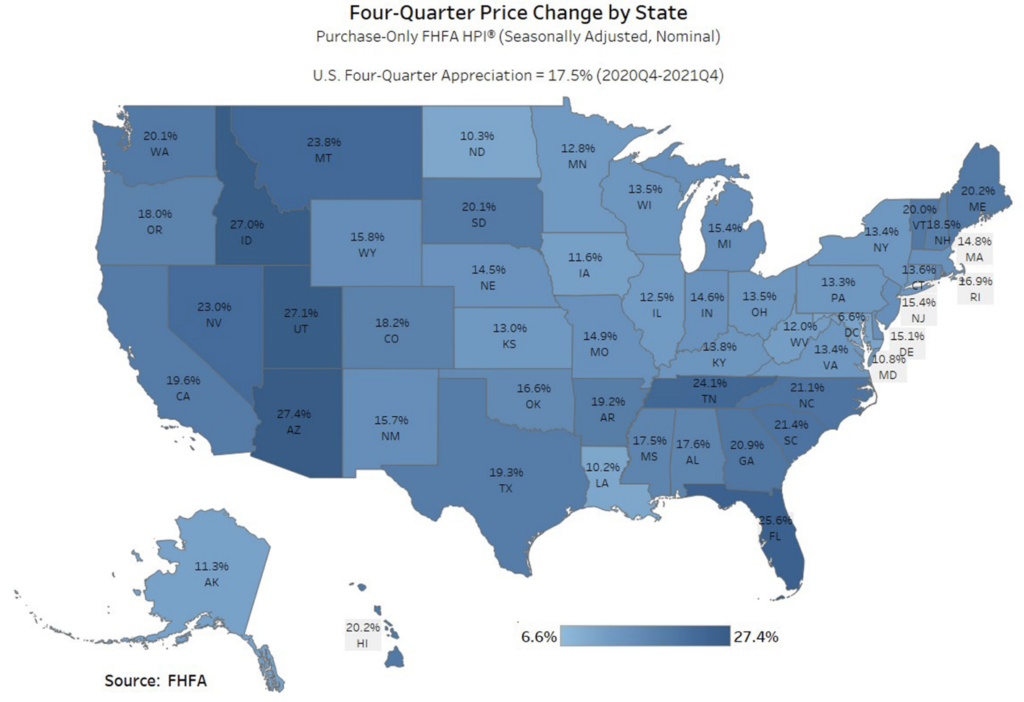
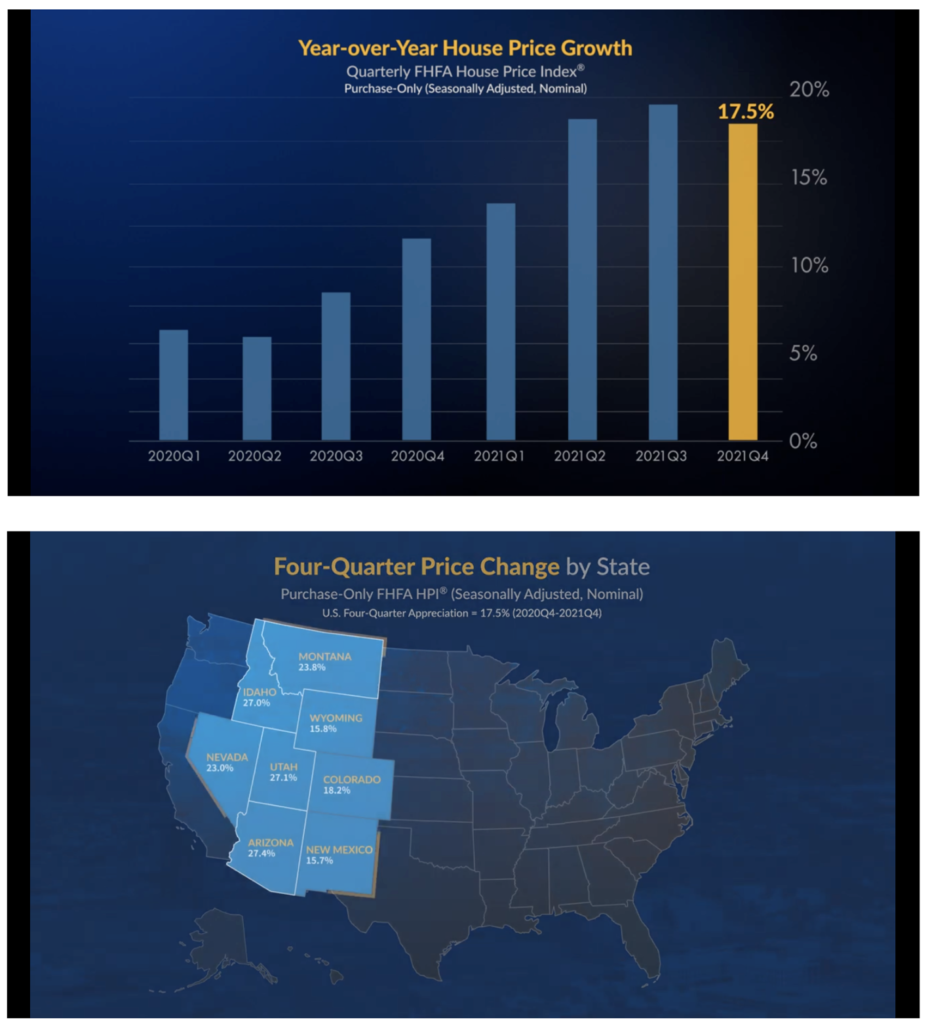
If we look at the big picture, US house prices rose 17.5% on average from 4th quarter2020 to the 4th quarter 2021
Change by State
All 50 states saw price appreciation in the 4th quarter.
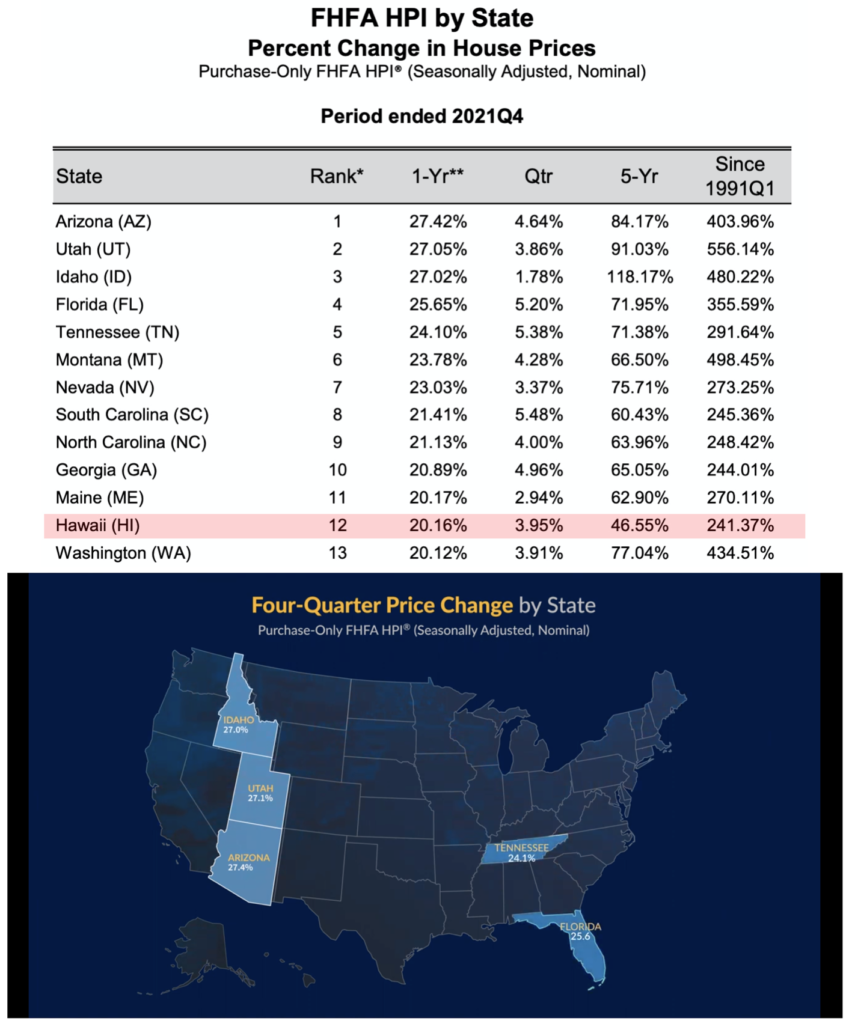
The state of Hawaii is ranked 12th, with a 20% appreciation.
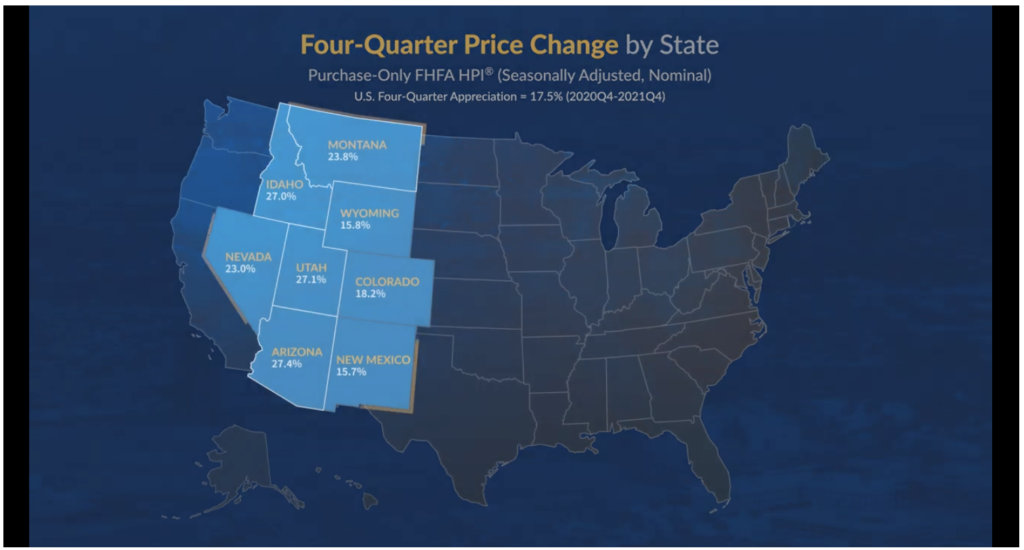
Arizona & Utah lead the nation with nearly +27% price appreciation
The Mountain Region is up and average of 23% and has been 1st or 2nd in annual price appreciation for the last 5 year.
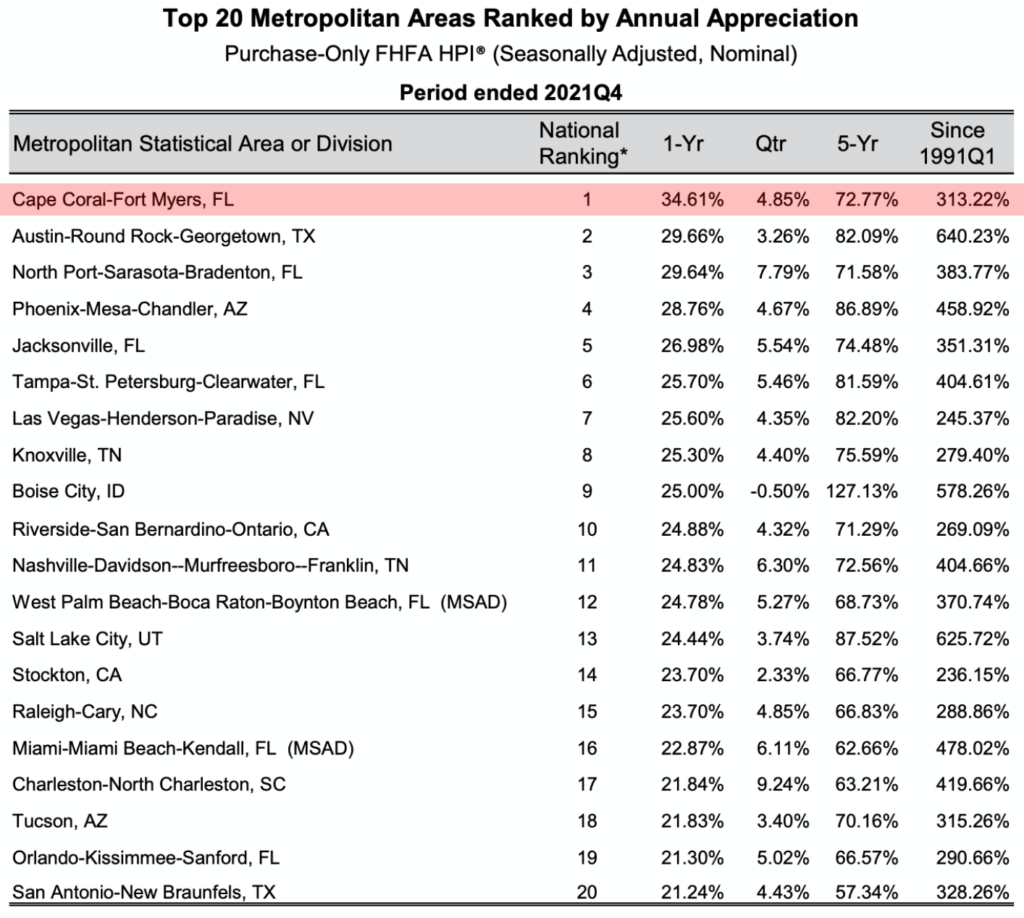
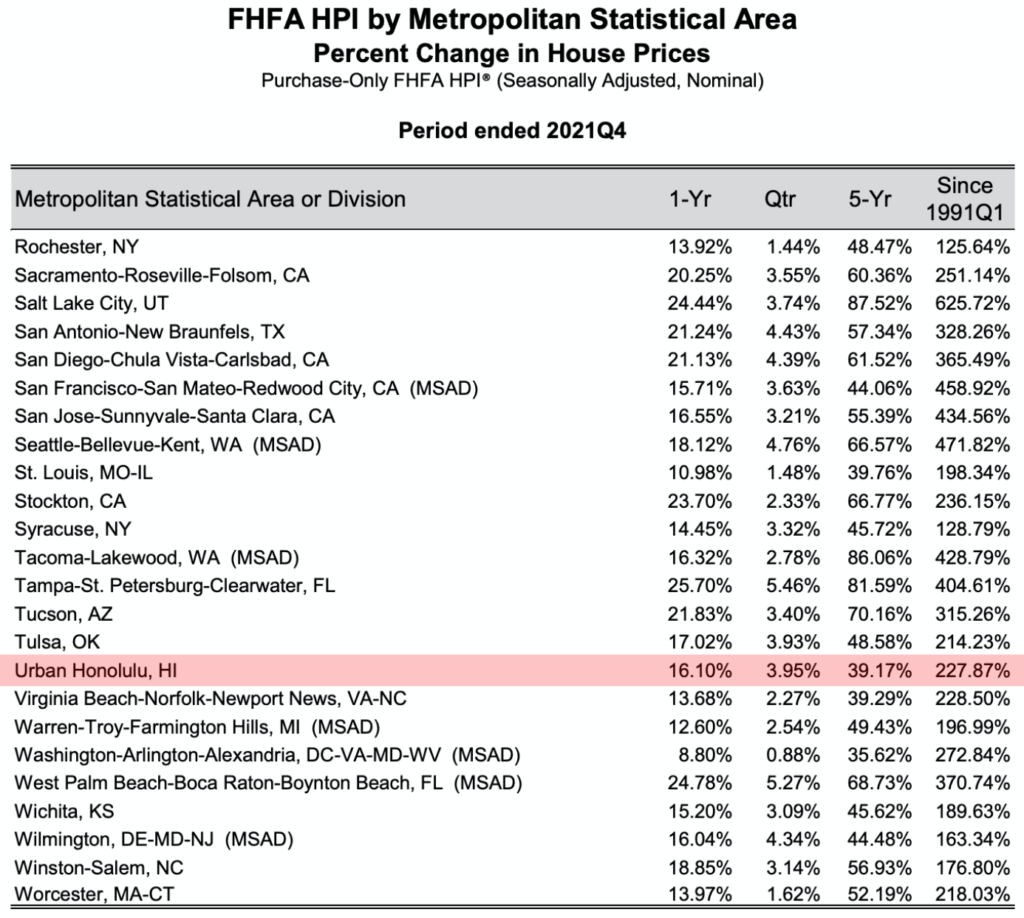
Price Change by City
Annual price increases were greatest in Cape Coral-Fort Myers, FL, where prices increased by about 35%.Prices were weakest in Frederick-GaithersburgRockville, MD (MSAD), where they increased by 8.5%
The City and County of Honolulu is up 16%, year over year.
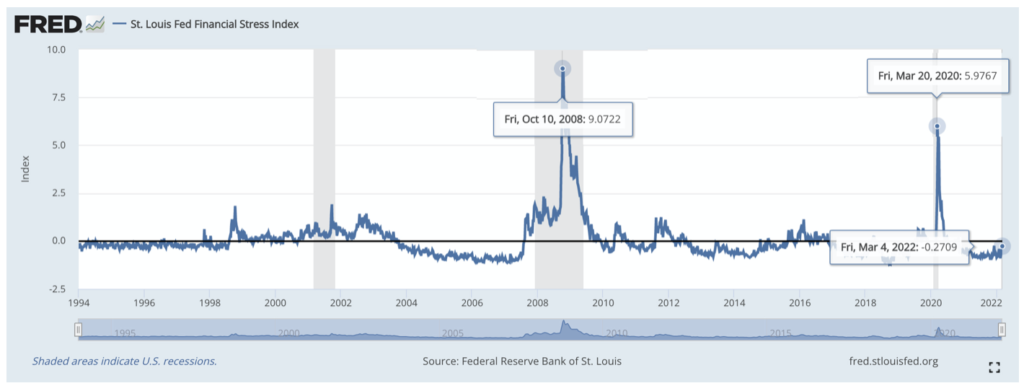
Financial Stress Index
The nation’s Financial Stress Index on March 4th, 2022 was -.27 points.This is down from about 6 points on March 20th, 2020. You can see we are down from the index’s highs of over 9 points during the financial melt down of 2008, highlighted in grey.
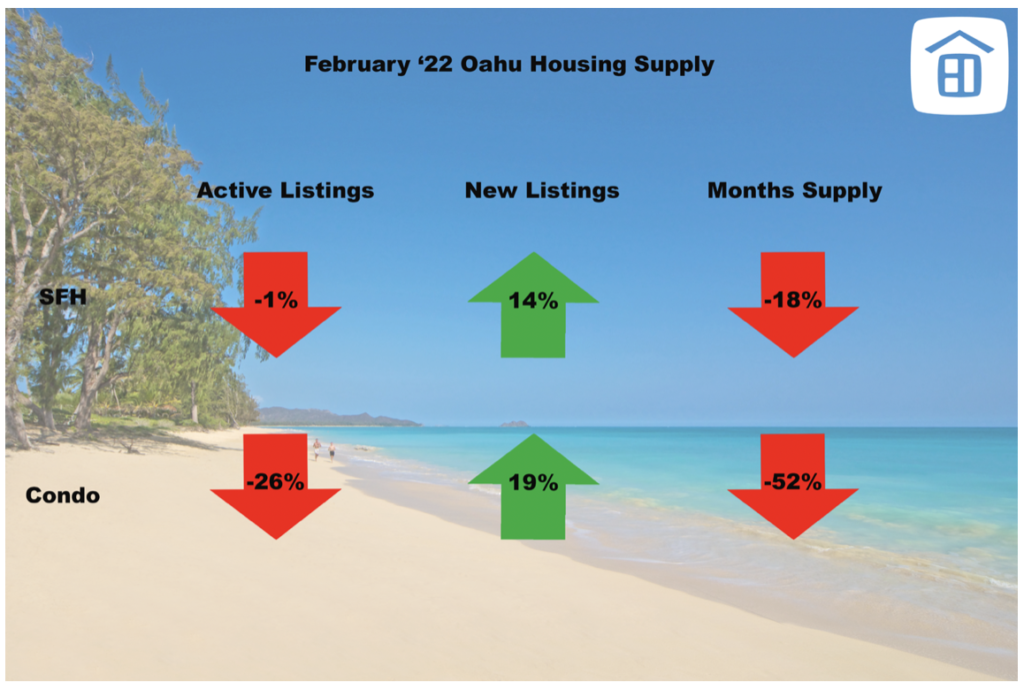
MONTHS SUPPLY – Monthly
In February, 2022, all the supply indicators are down across the board, except for New Listings.
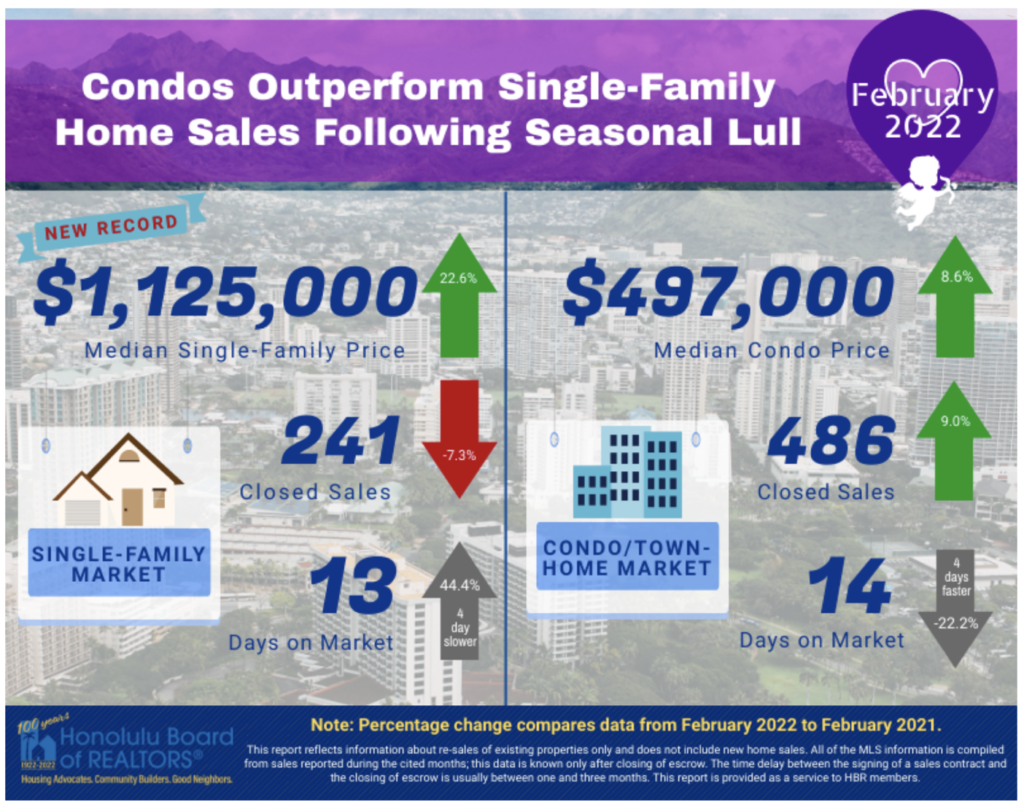
SALES – 2021
Median sales prices are up.Closed sales are down slightly and days on market up for single family homes.
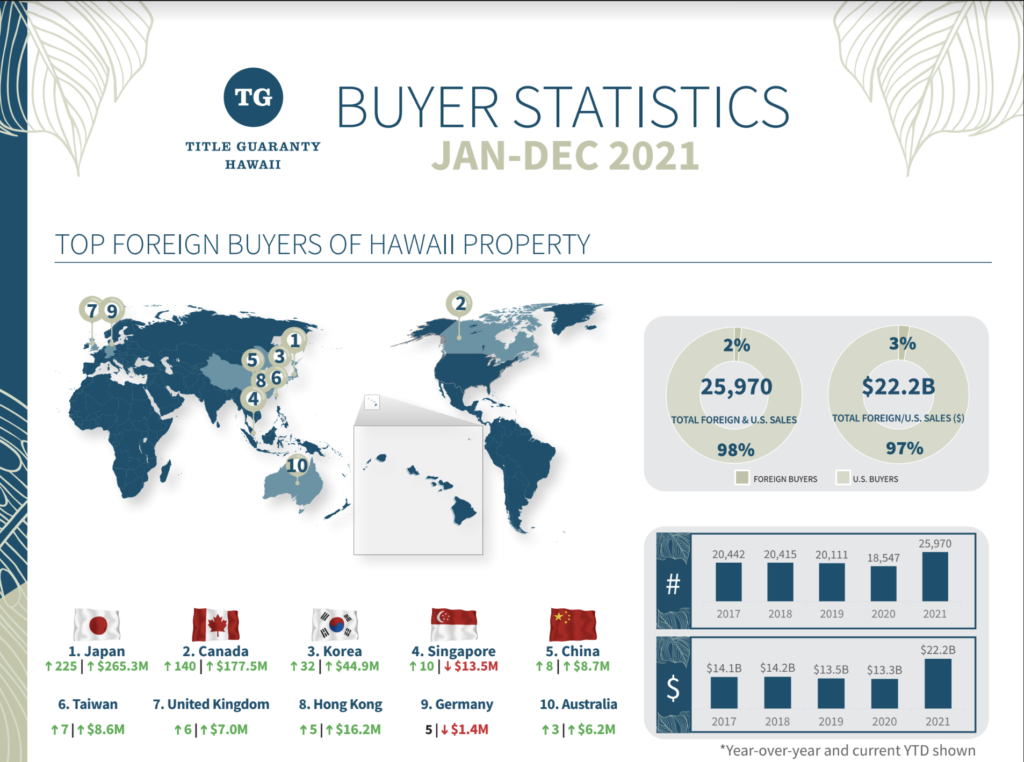
Who is Buying Hawaii Real Estate
For the entire state of Hawaii, nearly 26,000, or $22.2B, real estate transactions occurred in 2021.This sales volume is up 40% over the previous year.Fully 75% of the buyers were Hawaii Residents.About 10% were from California and the top foreign buyer was Japan, at almost 1%.
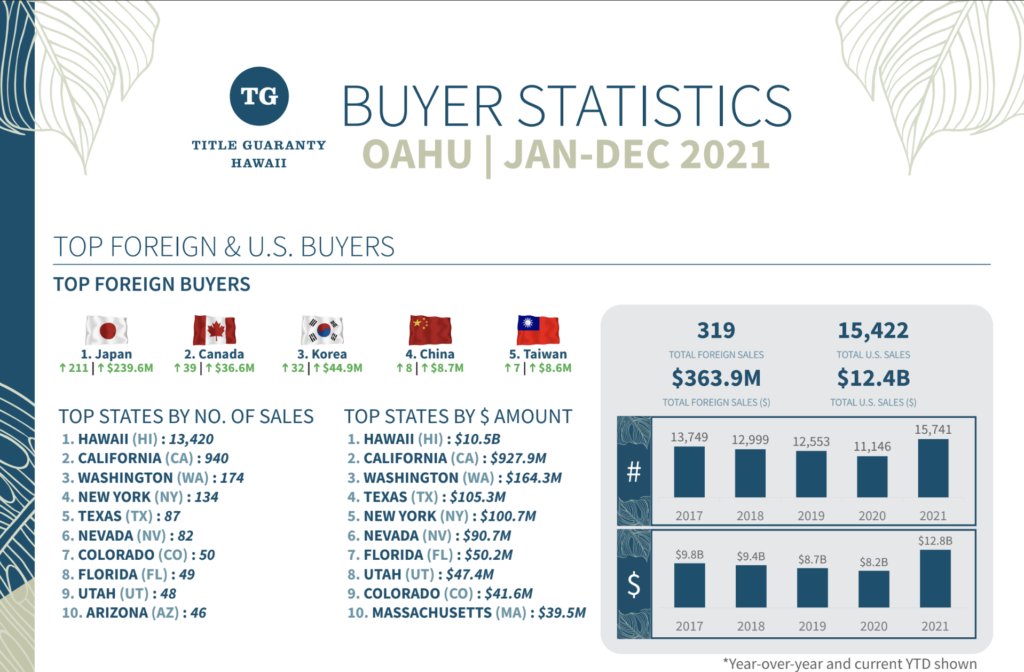
On Oahu, fully 87% of the transactions were Hawaii resident buyers and 6% were from California.Japan is the number one foreign investor on Oahu.94% of Japanese investment occurs on Oahu.
Price Growth
The market is still red hot, however, the rate of price growth plateaued in Q3 of 2021.In the first half of 2020, we saw above average growth levels at around 5-6%.In the second half of 2020, we saw border closings and supply chain issues.These issues impacted construction and renovations, which pushed up prices for real estate.In 2021, we saw 50 year low mortgage rates that caused intense demand.Couple this intense demand with low supply, and it is no wonder that Q3 2021, saw double digit gains in all 50 states and the District of Columbia. (Source FHFA)
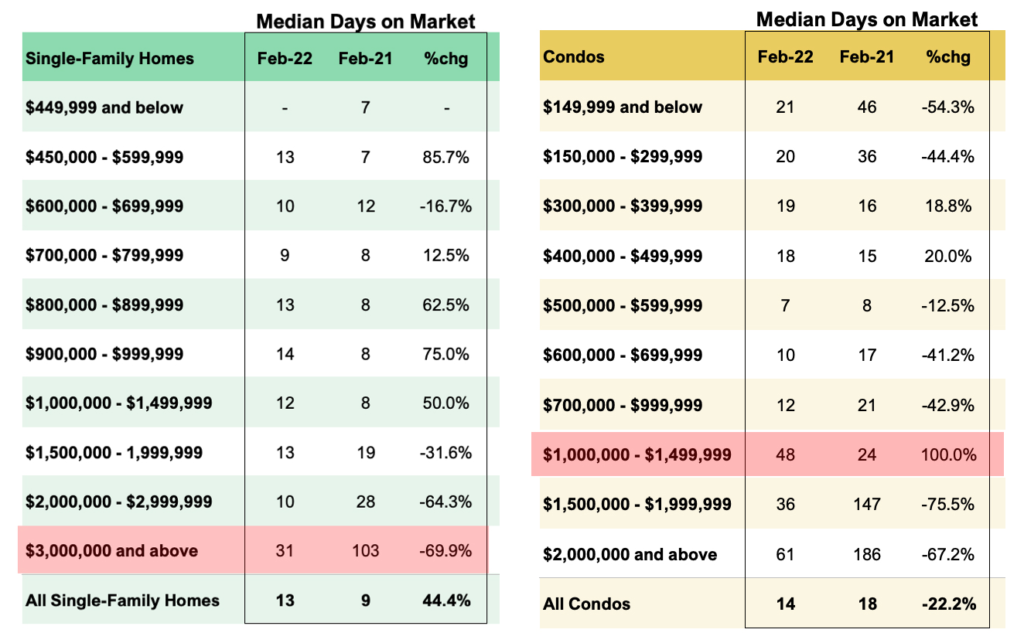
PRICE POINTS
If we compare market velocity and price point, on Oahu single family homes, we see it is fairly consistent at the low end of prices in the low double digits.However when we hit $3M and above, the days on market just about triple to 31 days.For condos, the breaking point is at$1M.
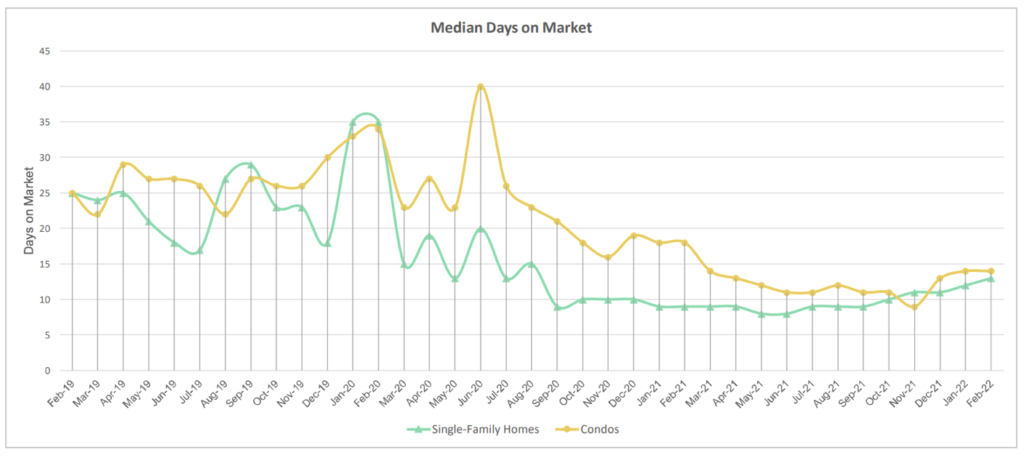
DAYS ON MARKET (Velocity)
Days on market is a good measure of “market velocity” or how quickly homes are selling.In the February, market velocity for single family homes is about 13 days for SFH & 14 days for Condos .These numbers are up about 44% for single family homes and down 22% of condominiums, year over year.
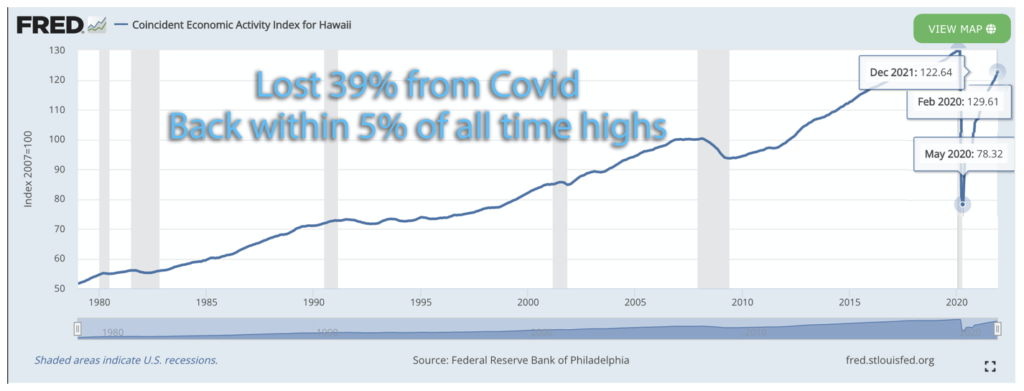
ECONOMIC ACTIVITY
The line in the graph represents an index that’s tracks Hawaii’s economic activity. We can see the last 6 US recessions highlighted in grey. Since the Spring of 2020, the index dropped 39% and is now with in 5% or Pre-Covid numbers.
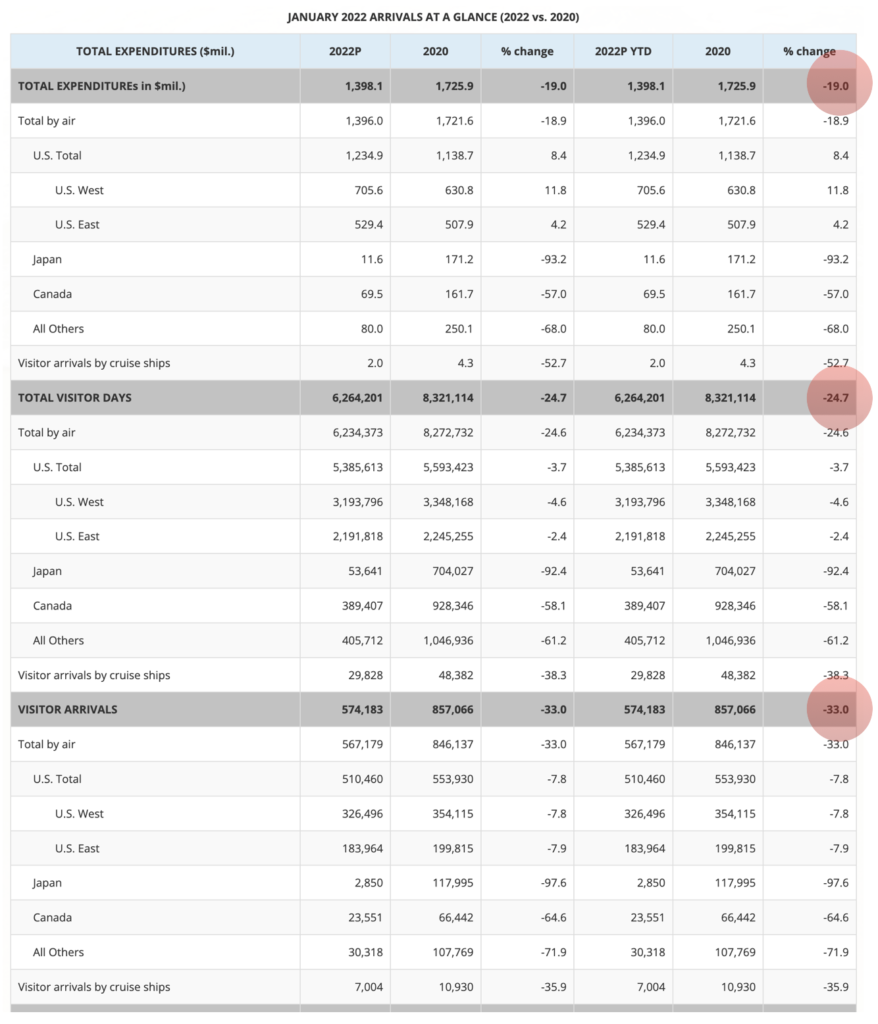
VISITOR Spending, Days & Arrivals
Visitor expenditures in January 2022 were 19% lower than January, 2020.
Visitor Days is almost with in 25% of pre Covid numbers.
Visitor Arrivals 33% lower than pre Covid.
SUMMARY
In summary, prices are up for both categories as a result of continued low supply and intense demand.Single family homes are showing some signs of slowing with lower closing volume and increased days on market.Supply remains low, but there is an increase in new listings.US Mainland and International buyer investment is up.Market velocity is right around 2 weeks to sell property and Hawaii’s economy continues to recover as Covid mandates are lifted.